Dashboard
The Dashboard is your high-level control center. It gives you a real-time snapshot of how your brand is performing across the different LLMs so you can quickly gauge visibility, positioning, sentiment, competitor performance, and prompt impact without digging through individual reports. Here are the core metrics you’ll be able to track: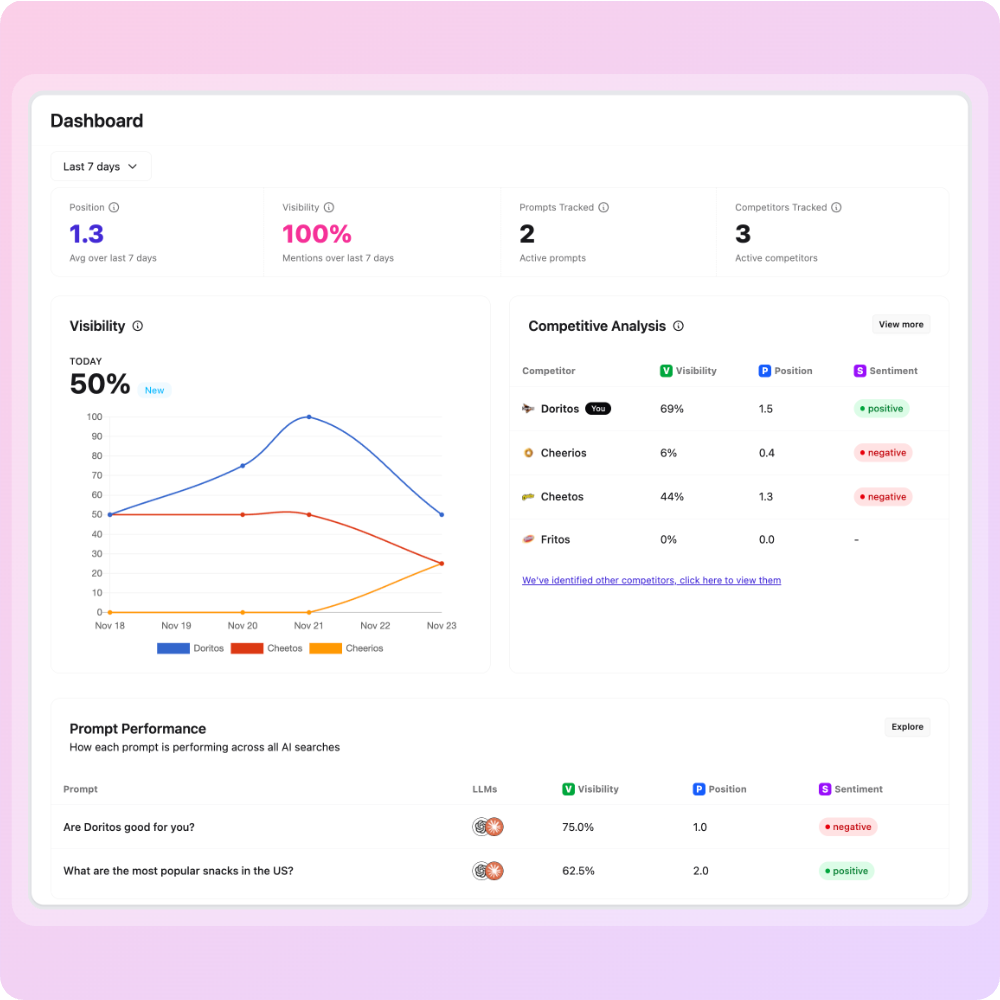
Top Metrics
These KPIs summarize your overall performance:- Position: Your average ranking across all responses (Lower = better).
- Visibility: The percentage of runs where your brand was mentioned.
- Prompts Tracked: How many active prompts are currently running.
- Competitors Tracked: How many brands you’re monitoring against.
Visibility Chart
This graph shows how your visibility has changed over time, day by day.- Each line represents a brand (you and your top competitors).
- The Y-axis shows visibility percentage.
- The X-axis shows dates.
- Spot trends (growth, drops, plateaus).
- Identify spikes tied to campaigns or events.
- Compare visibility trajectories vs. competitors.
🏆 Competitive Analysis
This table compares you directly with tracked competitors across three key metrics:- Visibility: How often each brand is mentioned.
- Position: How high each brand ranks in responses.
- Sentiment: Whether mentions are positive, neutral, or negative.
- Who’s leading the category
- Who’s losing visibility
- Which brands have positive or negative perception
🚀 Prompt Performance
This bottom section shows how each prompt is performing across all LLM searches. For each prompt you’ll see:- Which LLMs ran it
- Visibility %
- Position
- Sentiment